
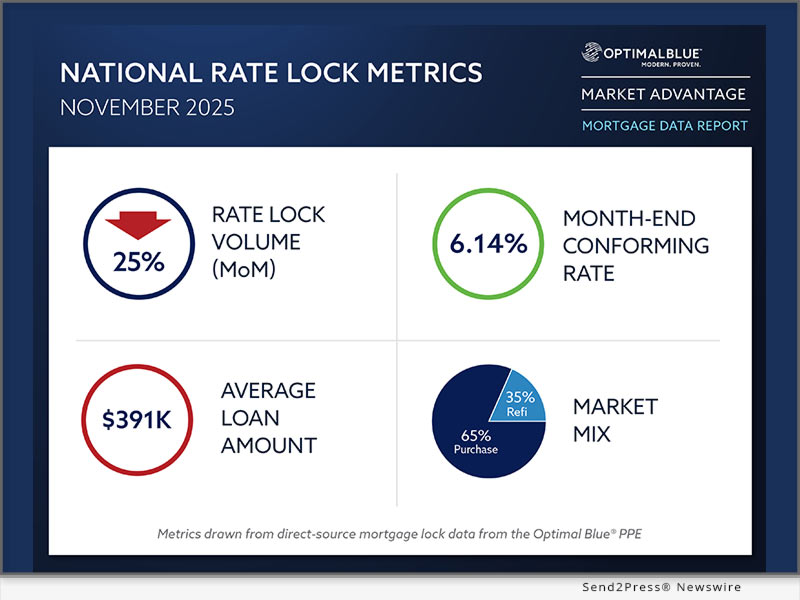
Optimal Blue today released its November 2025 Market Advantage mortgage data report, which found that total mortgage rate-lock activity declined with normal late fall seasonality, yet still marked the strongest November in four years. Total lock volume fell 25% month over month (MoM) from October but remained up 17% year over year (YoY), buoyed by historically strong refinance demand and mortgage rates holding near 6%.
Resilient refinance demand driven by current rates tempers the effects of seasonal slowdown
PLANO, Texas /Mortgage and Finance News/ — Optimal Blue today released its November 2025 Market Advantage mortgage data report, which found that total mortgage rate-lock activity declined with normal late fall seasonality, yet still marked the strongest November in four years. Total lock volume fell 25% month over month (MoM) from October but remained up 17% year over year (YoY), buoyed by historically strong refinance demand and mortgage rates holding near 6%. Rate-and-term refinances continued to outperform 2024 levels by a wide margin, finishing November up 223% YoY despite easing from September’s high. Cash-out refinances rose 29% YoY. Purchase lock activity declined 22% MoM in line with seasonal patterns and slipped 6% YoY as elevated home costs and limited inventory continued to restrain demand.
The Optimal Blue Mortgage Market Indices (OBMMI) 30-year conforming fixed rate, the benchmark for CME Group’s Mortgage Rate futures, dipped 1 basis point to 6.14% in November, marking a 53-bps improvement from the same period in 2024. FHA rates fell 5 bps to 5.99%, while VA and jumbo rates rose modestly to 5.76% (up 9 bps) and 6.44% (up 8 bps), respectively. The 10-year Treasury yield fell 11 bps to 4%, widening the mortgage rate spread by roughly 10 bps as OBMMI remained essentially flat.
“November’s data underscores a market still responding to rate relief even as seasonal patterns take hold,” said Mike Vough, senior vice president of corporate strategy at Optimal Blue. “Refinances remain the clear standout, with rate-and-term activity running more than triple last year’s levels and cash-outs continuing to outperform. It was a notably strong November by any measure.”
Lenders adjusted execution strategies in November as agency cash window sales rose 300 bps to 25%, interrupting the recent move toward greater securitization. Agency mortgage-backed securities (MBS) deliveries declined 100 bps to 45% after six consecutive months of gains, while bulk aggregator share dropped 300 bps to 27% and best-efforts executions increased 100 bps to 3%. The share of loans sold at the highest price tier fell 200 bps to 79%, while second- and fourth-tier deliveries increased. Mortgage servicing rights (MSRs) for conforming 30-year loans decreased 3 bps to 1.09% (a 4.36 multiple), in line with an average 15 bps decline across other OBMMI rate series.
“Execution strategies shifted meaningfully in November,” said Vough. “Lenders moved to the cash window as securitization momentum moderated, and pricing spreads broadened as more loans moved out of the top tier. These shifts point to lenders fine-tuning execution to manage price and overall delivery profile as the market settles into late-year conditions.”
Key findings from the Market Advantage report, derived from direct-source mortgage lock and secondary market data, include:
Volume trends and market composition
* Refis remain a major driver: Refinances accounted for 35% of all locks. Rate-and-term refinances rose 223% YoY despite slowing from early fall peaks, while cash-out refinances increased 29% YoY.
* Purchases decline: Purchase locks fell 22% MoM and 6% YoY as elevated home costs and limited listings continued to weigh on demand.
* Non-QM sets new record: Non-qualified mortgage share rose to 9%, the highest level recorded by Optimal Blue, with investor/debt-service-coverage-ratio (DSCR) programs accounting for a growing share of non-QM production.
* FHA, non-conforming pick up share: Product mix shifted toward FHA and non-conforming loans (including jumbo) at the expense of conforming and VA lending, supported in part by 5.99% FHA rates.
* PUD share ticks up slightly: Planned unit development (PUD) lock share, a reasonable proxy for new construction, rose relative to other property types but remained well below last year’s unusually high levels.
Rates and pricing
* Rates stabilize near 6%: The OBMMI 30-year conforming fixed rate ticked down 1 bp to 6.14%. FHA fell to 5.99%, while VA and jumbo rates rose to 5.76% and 6.44%, respectively.
* MSR values dip: MSRs for conforming 30-year loans fell 3 bps to 1.09% (a 4.36 multiple), moving in line with rate declines.
* Spread widens to 10-year Treasury: The 10-year Treasury yield fell 11 bps to 4%, widening the mortgage rate spread by roughly 10 bps as OBMMI remained mostly unchanged.
* Pricing tiers show more dispersion: The share of loans sold at the highest price tier dropped 200 bps to 79%, while second- and fourth-tier shares rose.
Channel and execution
* Cash window share increases: Cash window deliveries increased to 25% (up 300 bps) as lenders shifted execution away from aggregator and securitization outlets in November.
* MBS share pulls back: Agency MBS sales fell to 45% (down 100 bps) after six consecutive months of increases.
* Aggregator share declines: Bulk aggregator executions dropped to 27% (down 300 bps), while best-efforts executions rose to 3% (up 100 bps).
Product mix and borrower profiles
* Lower-rate programs gain traction: Lenders saw greater uptake in products benefiting from improved pricing, including increased FHA share at 18.8% (up 104 bps) and steady demand for jumbo and other non-conforming offerings at 17% (up 34 bps).
* U.S. buyer share rises: U.S. citizens accounted for nearly 94% of locks, extending a multi-month upward trend.
* Credit scores and loan sizes edge lower: The average credit score fell one point to 733. The average loan amount decreased to $391,323 from October’s $397,438. November loan averages ranged from $592,129 in metro New York to $295,526 in Indianapolis. Average loan-to-value ratios ranged from 69.79% in Los Angeles to 88.22% in San Antonio.
To view the full November 2025 Market Advantage report, complete the free subscription form: https://engage.optimalblue.com/market-advantage. Subscribers receive a report PDF each month with the latest data. Members of the press are eligible for special, advance access each month and should contact Olivia DeLancey to be added to the media list.
About the Market Advantage Report
Optimal Blue issues the Market Advantage mortgage report each month to provide insight into U.S. mortgage trends and drivers of lending profitability. Data is sourced from the Optimal Blue PPE, which is used to price and lock more than one-third of all mortgages nationwide, and Optimal Blue’s hedging and loan trading system, which supports approximately 40% of loans hedged and sold into the secondary market. As the leader in mortgage capital markets technology, Optimal Blue has a direct view of both origination and secondary market activity and the interconnectedness of the two. Unlike self-reported survey data, Optimal Blue’s direct-source data accurately reflect the in-process loans in lenders’ pipelines and secondary market executions. Visit Optimal Blue’s website to subscribe to receive the free report each month.
Nothing herein shall be construed as, nor is Optimal Blue providing, any legal, trading, hedging or financial advice.
About Optimal Blue
Optimal Blue powers profitability across the mortgage capital markets ecosystem. As the industry’s only end-to-end capital markets platform, our technology, data and integrations bridge the primary and secondary markets to help lenders of all sizes maximize performance – from pricing accuracy to margin protection and every step in between. Backed by over 20 years of proven expertise, our modern, cloud-native technology delivers the real-time automation, actionable data and seamless connectivity lenders need to navigate market volatility and scale for growth. To learn more about how Optimal Blue delivers measurable ROI, visit OptimalBlue.com.
Learn More: https://www2.optimalblue.com/
This version of news story was published on and is Copr. © 2025 Mortgage & Finance News™ (MortgageAndFinanceNews.com) – part of the Neotrope® News Network, USA – all rights reserved.
Information is believed accurate but is not guaranteed. For questions about the above news, contact the company/org/person noted in the text and NOT this website.